
You have the data. Do you have the knowledge?

Why accumulating wind farm information is not the same as understanding the turbine, and what this means for your decisions on operations and maintenance, repowering or grid codes.
An average wind farm generates hundreds of millions of data points per year. They are stored, visualised in dashboards, aggregated in monthly reports. And yet, in most technical conversations the question remains the same: what is actually happening in turbine 12?
The problem is not the amount of data; accumulating information does not generate knowledge. It is necessary to understand how it has been captured, how it has been aggregated and which physical variables are left out of the picture. That gap has very concrete consequences for the relevant decisions that any wind farm owner faces today: repowering, adapting to a new grid code, or adjusting operation to growing environmental requirements.
- The SCADA that is never fully read
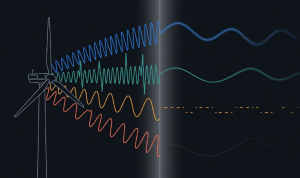 Pitch, yaw, angular speeds, power, structural loads, temperatures. All these variables are captured in the turbine controller at frequencies of up to 1 Hz or higher. And most of them are stored as 10-minute averages, perhaps accompanied by maximum, minimum and standard deviation.
That aggregation process is not neutral. Two turbines with the same average pitch can exhibit radically different fatigue behaviours: one oscillates smoothly, the other corrects gusts with abrupt excursions. Two angular-speed series with the same mean can hide transient peaks that never show up in any KPI.
There is an additional, less obvious problem: critical variables that no SCADA records. Internal bearing loads, the real angle of attack at each blade section, tip deflection, axial thrust. They are missing because installing that sensing on a commercial turbine is, in practice, unfeasible. And yet they are the magnitudes that determine the asset’s useful life.
These are just two examples where digital turbine models stop being an academic luxury. A physical model calibrated with the available data makes it possible to reconstruct the variables that are not measured; virtual sensors translate existing signals into unobserved magnitudes, blade root flapwise moment, wake centre position, tip-to-tower clearance, aerodynamic or structural states; physics-informed neural networks impose physical coherence on noisy or incomplete data.
Data is the raw material. The model is the tool that turns it into knowledge
- Repowering: the mistake of starting from scratch
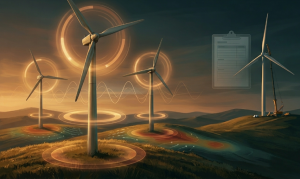 Between 2027 and 2030, Europe will repower between 5.5 and 8.5 GW of wind capacity per year.
Wind farms with 15 or 20 years of operation, with hundreds of thousands of hours of real measurements of the resource and of the site’s aerodynamic response. And yet, the usual practice in the energy yield assessment of a repowering project is to apply a greenfield methodology, as if the wind farm had just come into existence, as if there were no historical record. The typical uncertainty of a greenfield Energy Yield Assessment is 5–10%, higher on complex terrain. That uncertainty bears directly on the P90 of the forecast production, and P90 is the number the bank looks at when financing the project.
The operating history of a running wind farm would allow that uncertainty to be reduced significantly: wind speed extrapolated with years of local measurement, real power curve under the site’s climate, losses identified by the specific behaviour of each position. But this is only possible if that history can be read, if it is understood which averages are hiding systematic losses, which yaw misalignments have been carried for years, which surface-degradation events (erosion, soiling or icing) have distorted the power curve.
.
Treating repowering as greenfield is not a technical decision. It is the consequence of not having built knowledge on the data that was already there
- New grid code: quantifying the impact on the existing asset
When a reinforced grid requirement is published — more severe LVRT (low-voltage ride-through), stricter ramp rates, dynamic reactive power support — the owner faces three questions: how often per year is this requirement triggered in my farm? how much does compliance cost in structural damage and production? with what confidence can I commit to it over the asset’s useful life? All three answers live in the existing data.
A voltage dip is not a purely electrical event. When the electromagnetic torque collapses for milliseconds, the rotor accelerates due to the imbalance with the aerodynamic torque. The oscillations propagate through the drivetrain and excite the tower’s natural modes in longitudinal and lateral bending. A transient structural excitation that leaves its mark on the accumulated fatigue for the rest of the asset’s useful life.
Without a technical reading of SCADA, the owner accepts the commitment blindly, oversizes equipment, assumes structural curtailment as a conservative measure. With it, they quantify the real cost and negotiate with an informed view.
Own knowledge, not a third-party black box
Without learning built on the available information, every new requirement is treated as if it were the wind farm’s first day of operation
And it is precisely that knowledge that the market is struggling to access. WENDY turns wind farm information and operational data into knowledge, relying on digital turbine models that contextualise each signal within its expected physical behaviour, on data corrected with detail engineering, on AI applied with engineering criterion, on predictive analytics for structural damage and erosion with operational foresight to optimise decisions against prices and curtailment. Designed for the intelligent management of data in an industrial environment and to support decision-making, avoiding critical investment requirements or intrusive actions on the wind farms.
